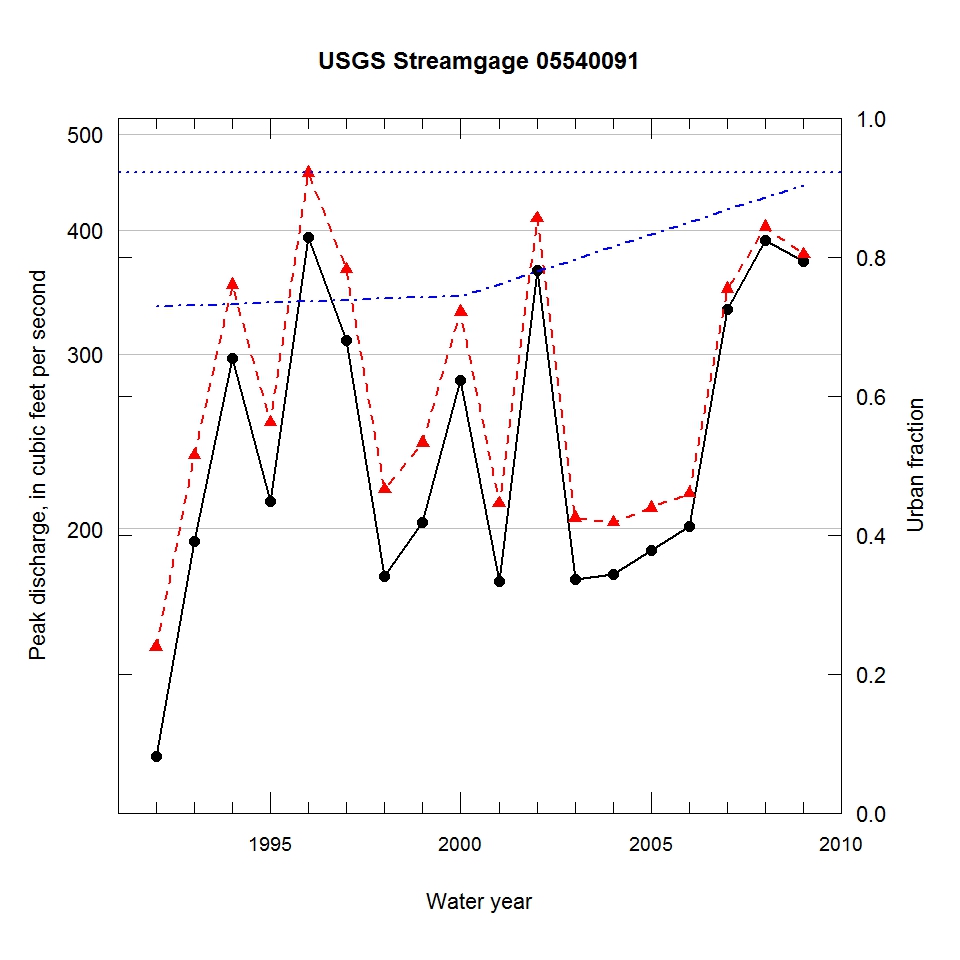
Observed and urbanization-adjusted annual maximum peak discharge and associated urban fraction and precipitation values at USGS streamgage:
05540091 SPRING BK AT FOREST PRESERVE NR WARRENVILLE, IL


| Water year | Segment | Discharge code | Cumulative reservoir storage (acre-feet) | Urban fraction | Precipitation (inches) | Observed peak discharge (ft3/s) | Adjusted peak discharge (ft3/s) | Exceedance probability |
| 1992 | 1 | CE | 0 | 0.729 | 2.198 | 118 | 152 | 0.782 |
| 1993 | 1 | C | 0 | 0.731 | 0.983 | 194 | 237 | 0.363 |
| 1994 | 1 | C | 0 | 0.732 | 2.696 | 297 | 352 | 0.096 |
| 1995 | 1 | C | 0 | 0.734 | 1.583 | 213 | 256 | 0.276 |
| 1996 | 1 | C | 0 | 0.736 | 7.806 | 393 | 457 | 0.036 |
| 1997 | 1 | C | 0 | 0.738 | 2.723 | 310 | 365 | 0.083 |
| 1998 | 1 | C | 0 | 0.740 | 1.122 | 179 | 219 | 0.451 |
| 1999 | 1 | C | 0 | 0.742 | 0.892 | 203 | 244 | 0.327 |
| 2000 | 1 | C | 0 | 0.743 | 1.646 | 282 | 331 | 0.123 |
| 2001 | 1 | C | 0 | 0.761 | 0.970 | 177 | 212 | 0.484 |
| 2002 | 1 | C | 0 | 0.779 | 3.568 | 364 | 411 | 0.051 |
| 2003 | 1 | C | 0 | 0.797 | 2.139 | 178 | 205 | 0.515 |
| 2004 | 1 | C | 0 | 0.815 | 0.885 | 180 | 203 | 0.523 |
| 2005 | 1 | CE | 0 | 0.832 | 1.465 | 190 | 210 | 0.492 |
| 2006 | 1 | C | 0 | 0.850 | 2.473 | 201 | 217 | 0.457 |
| 2007 | 1 | C | 0 | 0.868 | 3.356 | 333 | 349 | 0.099 |
| 2008 | 1 | C | 0 | 0.886 | 2.990 | 391 | 403 | 0.055 |
| 2009 | 1 | C | 0 | 0.903 | 1.025 | 372 | 378 | 0.072 |

